Do you collect scattered marketing data across multiple channels and platforms?
Working with data scattered across different channels and platforms can be an overwhelming experience. Your sales data may be in Shopify, Magento, or some other e-commerce platform. Your online marketing data generated through paid ads may be distributed across Facebook, Google Ads and other platforms. Then you may have e-commerce data enriched with Google Analytics, data on customer relationship management platforms, data on email marketing platforms, and many other data sets.
Copying and pasting all of this data from native analysis platforms or dozens of CSV files can be a nightmare. The good news is that there is a smarter and simpler way to consolidate all of these data sets without wasting hours of your valuable time.
Thanks to prefabricated data connectors, you can transfer data from many different sources directly into Google Sheets, Excel or Google Data Studio. This lets you avoid the time-consuming process of consolidating data and switching between platforms so that you can concentrate on analyzing the data instead. The smart successor to e-commerce analysis enables you to bust open data silos and boost the productivity, efficiency, and flexibility of your company.
Automate your e-commerce dashboards
Once all of your data has been consolidated, the next step is to automate it. Instead of manually creating reports, you can set up your reports to update automatically while you concentrate your efforts on data analysis and creating value for your customers and target groups.
Automating the process not only saves you time and energy, it also minimizes the risk or errors. This helps you create a data-driven culture by reducing the effort linked to creating reports, letting your focus on analyses and insights.
But for the moment, we will put the topic of automation on hold. For now, we will look at some popular and effective methods for making sense of your e-commerce analyses.
In addition to conventional tabular calculations, there are also more advanced options for gathering your data together to form a single source of truth. Which option best fits your company depends on your expectations and the complexity of your data. Let’s take a look at the pros and cons of the most important options available.
Tables – the data aggregation classic
Tabular calculations form the basis for all data analyses, as all figures are stored on spreadsheets in Excel or Google Sheets. There are many advantages which speak in favor of using tabular calculations for data aggregation.
The biggest advantage is the inherent simplicity. There is no learning curve, as most of your team members likely know how to use tables. They are also easy to use. You can simply copy data from anywhere and paste it into a table. Tabular calculations are also easy to analyze because they enable simple evaluations of data relating to products, means of interaction, and other important aspects. Collaboration is also a relevant point, as Google Sheets and Excel can generally be accessed from any computer.
But there are also disadvantages which can make tabular calculations a sub-optimal solution in some cases. We’ll discuss these in the next point.
What are the disadvantages of using tabular calculations for data aggregation?
The possibilities presented by tabular calculations are limited in their usefulness when it comes to reaching your goals. And these limitations can grow into serious issues in keeping with the growth of your online store and online marketing.
Firstly, the space in cells is limited, so that large amounts of data from different sources may not fit. Secondly, they are not equipped to handle complex queries. Tabular calculations are not ideal for managing historical data, as this will quickly exceed the capacity of tabular calculations. They are not automated, so you have to manually copy and paste data, which is slow and difficult.
How can you know if tabular calculations are the right option for you?
Taking the above-mentioned pros and cons into account, tabular calculations can be ideal for your brand if…
- Your company is a micro or small enterprise.
- You do not yet use broad multi-channel marketing.
- Your marketing is limited to a handful of channels.
- You do not yet need complex data queries.
- You want a data aggregator which you can begin using immediately, without any learning curve or investment requirements.
Let’s take a look at another kind of data aggregation
The advantages of data visualization tools
Data visualization tools, such as Google Data Studio, go beyond tabular calculations and organize your data visually. This helps your team members maintain a quick and clear overview of performance across all channels.
The advantages of data visualization tools are manyfold. Firstly, they are perfect for quickly delivering comprehensive insights. Thanks to automated dashboards, you do not need to copy and paste data before you can visualize it. Important information is prominently displayed, letting you access key insights in just a few clicks. Visuals are also easy to understand and are ideally suited to presenting data to your management team. Let’s be honest, most people in management are not data analysts.
What are the disadvantages of data visualization?
The birds-eye view which you get with data visualization tools and their undisputed usability can be disadvantageous in some contexts.
The over-simplification of data can result in your overlooking insights which are hidden in nuances. Only “important” data makes its way into visuals, while data which is considered to be “less important” may not be included in analyses. You are also undoubtedly dependent on specific tools to interpret data, to a certain degree. In other words, you do not interact with the raw data, so you cannot draw your own conclusions.
Is data visualization the right solution for your online store?
Data visualization tools can be a superb addition to your data analytics. They are especially useful for situations in which you need insights quickly and do not have the time to carefully study data yourself. That makes data visualization tools a good choice for businesses which…
- want to learn how to use data in decision-making.
- do not have a specialized data analysis team, but still want to use data insights.
- want to extend their existing tabular calculations or other raw data solutions with a tool which analyzes the whole picture.
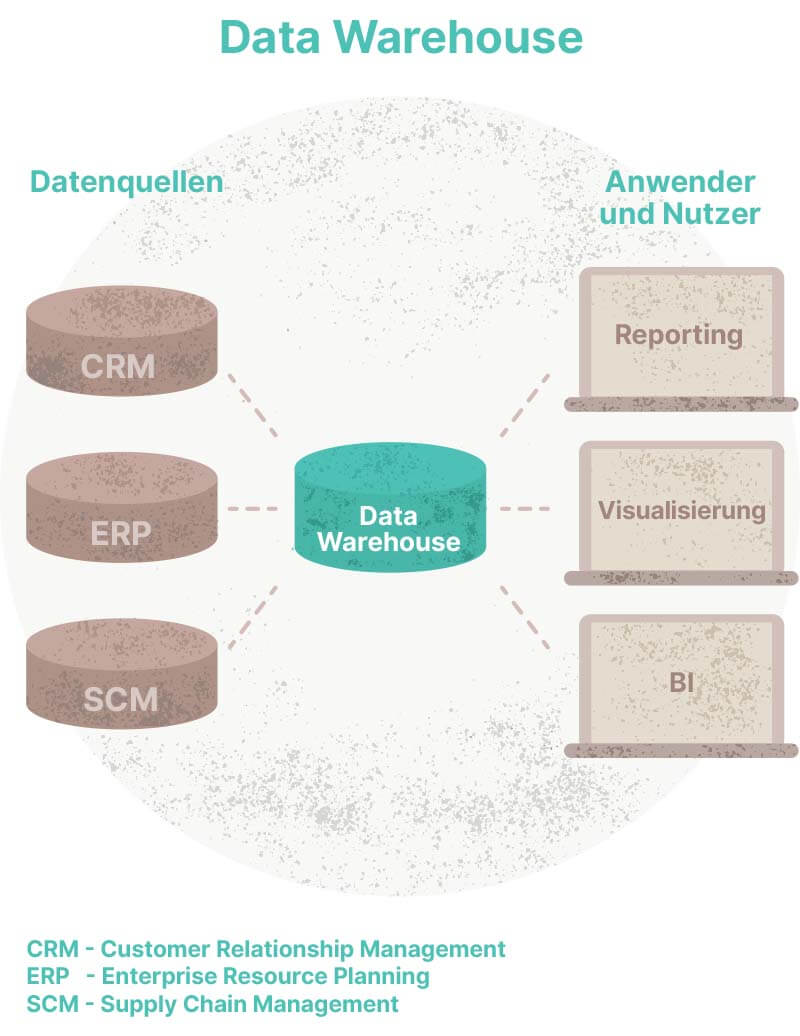
Finally, data warehouses provide a third option for data aggregation. Here we can see what they have to offer.


